


MORE DETAILED LOOK AT SERVICE PLANNING COSTING PART 2
For those of you who attended my TASSQ presentation, this post is not new, but for those that did not, I wanted to so a post to give you some background.
The example we used at TASSQ was;
“If you have an assignment to test 500 services, each service has 10 functions and each function requires 4 tests, upper boundary, lower boundary, and 2 negatives. Using service plan costing, the total number of test cases you would need to test is then 500 x 10 x 4 = 20,000.”
Now before you say, there hundreds of ways to reduce that number, let me agree and say, yes there are many ways we could. But lets leave that discussion for other posts, or another presentation (was actually something I was going to speak to) and pretend that this number is is the result AFTER all optimization is done. The Reducing Amount of Test Coverage series of posts will address ways this can be done.
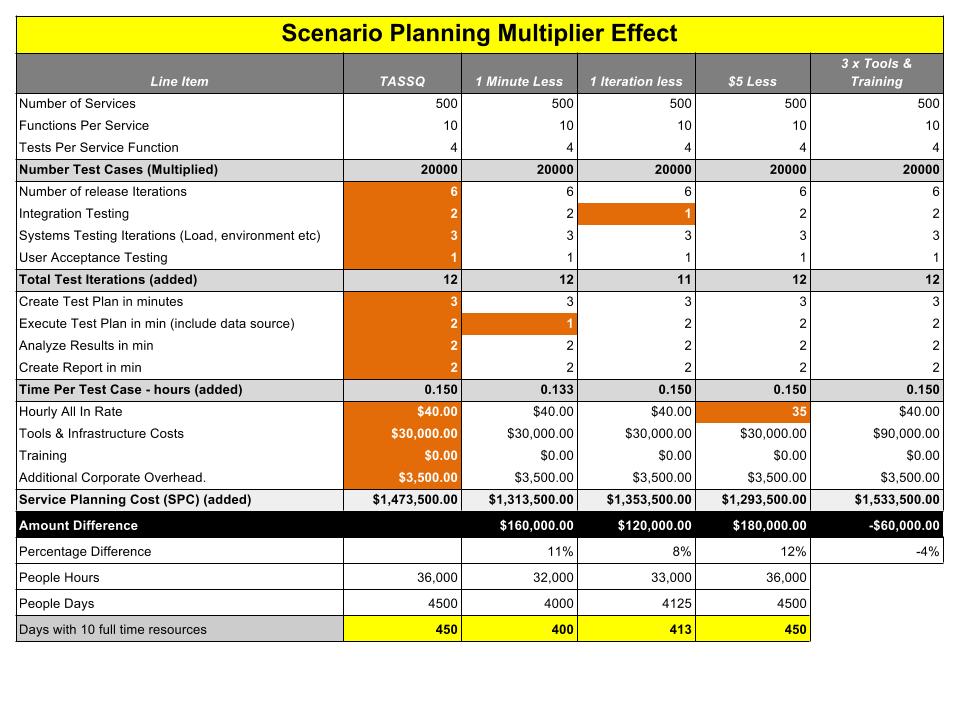
The TASSQ numbers were numbers in the second column, I got polling the audience, and I believe are pretty conservative.
- Number of Release Iterations – This is how many times you get a code drop from Development that is tested by QA. Each time, QA runs through a series of tests, be the manual or automated.
- Integration Testing is testing integration with Identity systems, 3rd parties and existing systems.
- System Testing includes testing the system as deployed. Testing the environment. Load vs performance, DR, preproduction, and production etc.
- Time per test case, is a breakdown of time taken to run a single test
- Hourly Rate all in, needs no introduction – we tend to have a slavish focus on this number which often translate into salary cuts.
- Tools and Infrastructure costs is the capital expense for buying software etc. to test
- Training – far to often Zero
- Additional overhead, any number not previously in there, like recruiting costs etc.
The result is a project cost of $1,473,500 which would take 10 resources at 8 hours a day 450 days to test.
Now for the not so obvious Truth about Testing.
- In Column 3, we changed 1 number, test time, to understand the effects it has. If you could save 1 minute a test case, the multiplier effect translates this into $160,000 savings or some 11%. How do you like that for a reason for optimization or Automation. Time and Time again I am told, “but we can do the same thing in-house without buying tools” and time and time again, I ask, “but does it take more or less time”. I heard QA staff complaining about no training, and yet, a course would be cheap in comparison. More Importantly for some we cut 50 days off testing time!
- In Column 4 we dropped one test cycle for a saving of $120,000 or 8% or 37 days. Remember the last time development gave a code drop that was not fully baked? Why do people use different tools and test case’s for functional and performance tests, when they could wrap them into one?
- In Column 5 we reduced the hourly wage by $5/hour. The effect, $180,000 or 12%, yet time remains constant…. Not as much effect as you thought perhaps?
- Column 6 we tripled tool costs, in an effort to reduce testing time or release cycles. The effect is some 4%
Conclusion
So regardless of if your business uses service plan costing or not, it is a valuable tool for understanding and dissecting QA costs. For focussing attention on the matters that really effect costs. In fact, I believe KPI and pareto analysis of these KPI is important for any QA manager. I always like to hear ideas that reduce testing time or test cycles, so please, feel free to share your thoughts.