Search for:

TASSQ Presentation

I want to thank everyone for their participation and input in last nights TASSQ presentation. Although its was a very simplified scenario, using a LOT of Averages, and the fixing of the 20,000 test cases required limited options, the limitations were set to demonstrate the impact of change more clearly. If we had more time, we could have looked into changing coverage ratio’s and changing the number of test cases required per Release or test iteration. I encourage everyone to do just this, using the own projects, to see what personal insight it will provide.

I have put the slides and spread sheet used for My TASSQ presentation on Google Docs for view or download.

Much of what was presented is in more detail on this blog, which you can subscribe to receive a monthly newsletter of updates. I also encourage all to make comments and share thoughts. Only a screen name is displayed.

Thank you again, and I hope you found it as interesting as I did.

More Detailed look at Service Planning Costing Part 1

In an earlier series, I went over a number of costing models that I have come across, that are used by different organizations. Service Planning Costing being one of the more detailed and specific, and often used by outsourcing companies. What is most interesting around service plan costing, is that a change of a single iteration, or minute in testing time can have major impact to the total price for the project. That said, I have seldom met an organization that has statistics or KPI on test times.

To understand this better, lets look at Testing as just one part of the Software Development Life Cycle.  The majority people experience higher testing costs during product maintenance than development, yet at that point expenses have settled and are generally known. During the testing phase however, there are many more unknowns.

Testing Levels

During software development testing, there are a number of different levels or test types. The first and most common test is the basic unit test, testing a function in the service to ensure that it does what it is intended to do. Each time the code is revised, a unit test is usually run to ensure that nothing unexpected has resulted. At some point, code is consolidated in a “release drop” and Integrated testing is done. Integrated testing, ensures that each unit interoperates with the others. Systems Testing is the next level and is around testing the entire system. This includes things like security testing, Performance testing under load, and other specialized tests to cover different environments. At each of these testing levels and each test iteration is usually compared to the previous baseline, in what if normally referred to as regression testing. The final testing level is user or business acceptance testing.  Depending on the complexity of the application and the development approach and the maturity of the organization, there can be anything from 5-50 Testing level iterations. For example, in Agile environments, the sprints are usually shorter, yet need to include each of these test levels, while in waterfall, a company may only begin integration testing once all unit testing is completed.

Test Cycle


Now each test Iteration at each testing level follows a process. A Test plan is developed, and the expected outcome along with intended inputs is created. This then is executed in a given environment, and the outcome is compared and analysed against what was expected. Any unexpected results or differences require further analysis. Afterwards a test report is completed, detailing what was done and the result The test cycle can be brief, in a unit test or lengthy as it may be in acceptance testing. In a single web service, there may be 10-20 function and each function may need to be tested. Possibly with a positive and negative or some other boundary requirement. The result could be hundreds of test cases for a single web service. Thousands of test cycles can make up a single test level and each test level can be repeated with each code drop or systems change. Since employee salaries are the largest costs in software testing, its makes estimating these times essential.

Since each of these processes is repeated exponentially, a small variance of a few seconds allocated to each test cycle or to the number of test levels in costing, can result in huge impacts to the costs. This is especially difficult to manage, when environments, code releases and other parties invested n the process may not appreciate the costs impacts.

This touches on core issues with QA and testing costs. I will be speaking more on this Tomorrow at TASSQ meeting in a workshop, and in future posts. Drilling down on some thoughts on how to reduce the costs and increase the accuracy of costing. In the mean time please feel free to comment below.

Installing a SOAPSonar License Server

SOAPSonar comes in a per seat and floating license models. Floating license are popular for occasional users and offshore sharing as they allow SOAPSonar to be installed on as many users machines as you would like, and only counts concurrent users.

The license controller application is only used briefly on checking out of the license and checking the license back in. The instance of SOAPSonar still runs on the local machine. As such minimal “server” load and network is required. The license controller is in fact a small process that runs on a windows machine, which requires a static IP address. On my machine its says its using 20,000k of memory, about 33% of chrome and the entire file is only 4.2 MB.

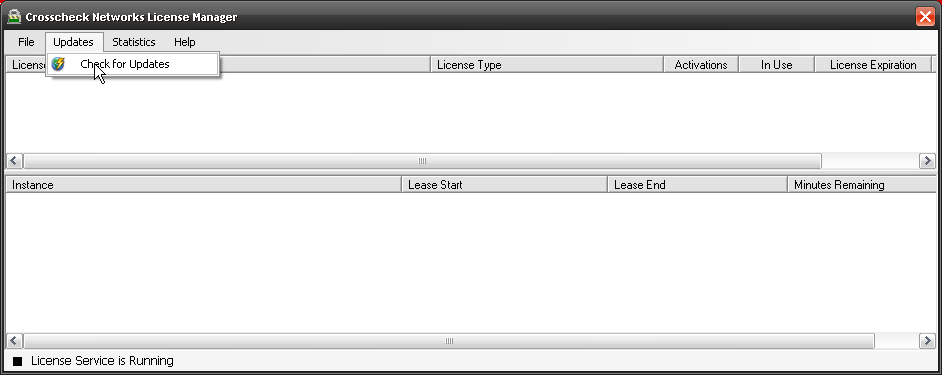
1. To install the license Controller start by downloading it from here. Install this on your server with Admin Rights. Once installed, although I try keep this post up to date, please check immediately if this is the latest version.  To do this, run the license controller and select Updates, Check for Updates.

1. Check for updates

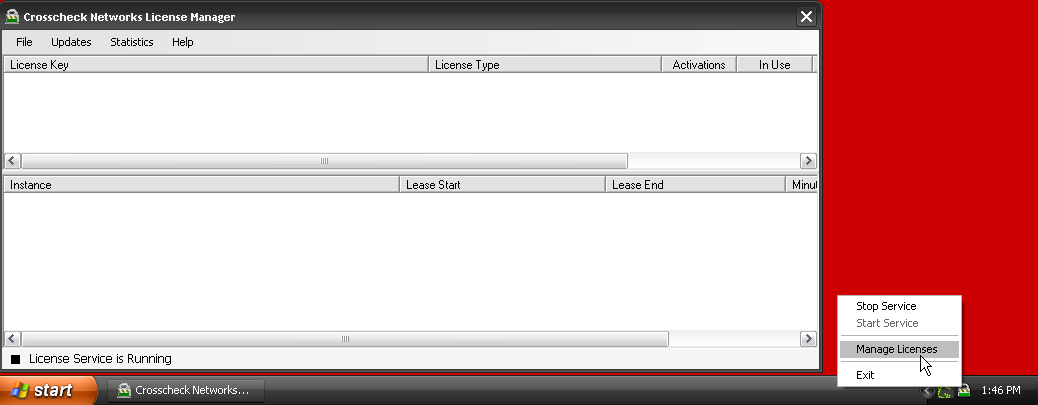
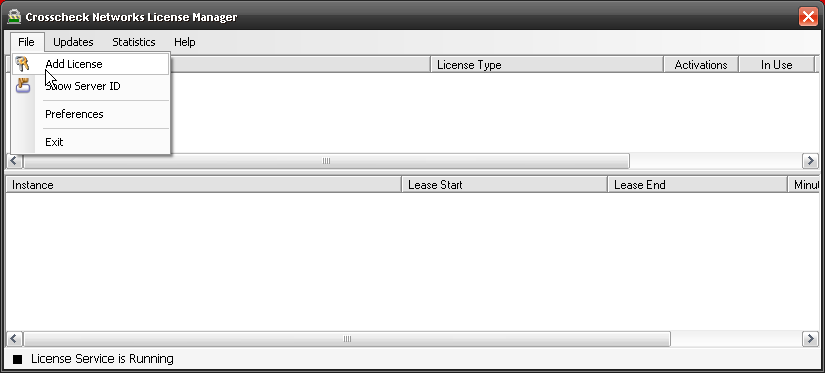
2. Make sure the the process is running and automatically starts on your server. If the service is unavailable, license will not be available to check in or out. Right-Click on the icon in your tray, and select Manage Licenses.

2. Process

3. Every server is fingerprinted, and your licenses tied to that server. Select File, Show Server ID, and copy this value. Send this FingerPrint ID to [email protected]

3. Show Server ID

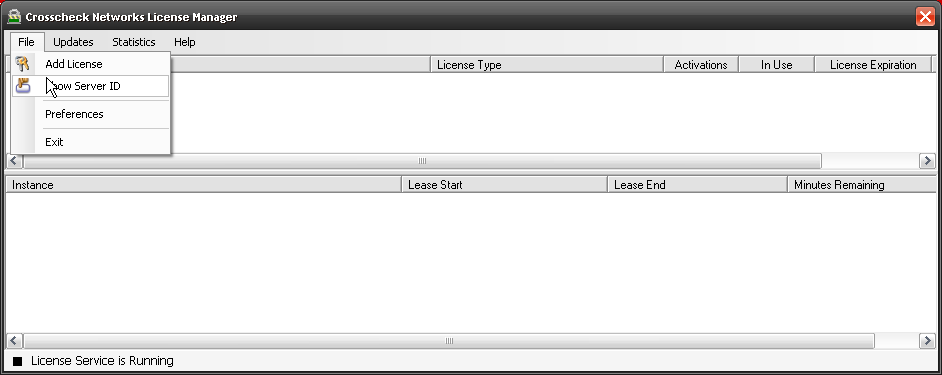
4. Your license will then be generated by Crosscheck Networks for that server ID, and we will send you back your license key. Select File, Add Licence Key and paste your license. Select OK. Each group of licenses should now show as a line item.

4 Add key

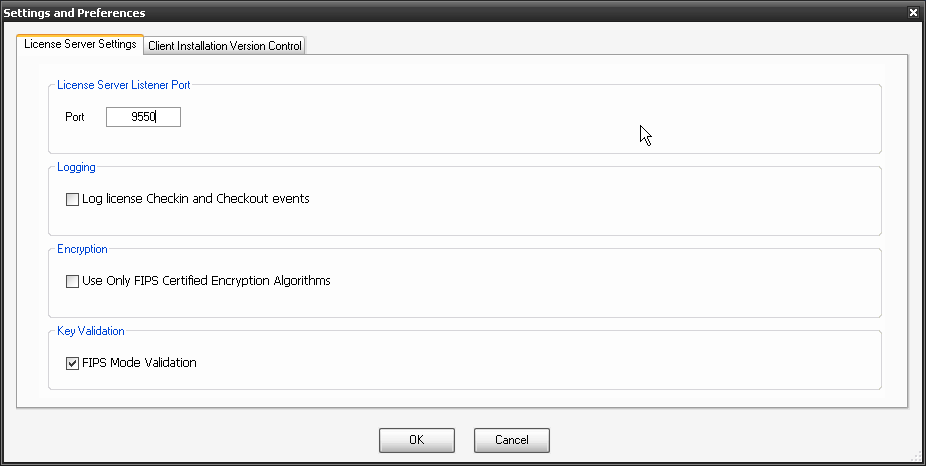
5. Select File, Preferences, and confirm and on the License Server Settings tab, confirm your port number. Run cmd, then enter ipconfig to get your IP address. These are needed for users to connect to the server.

5 port and IP address

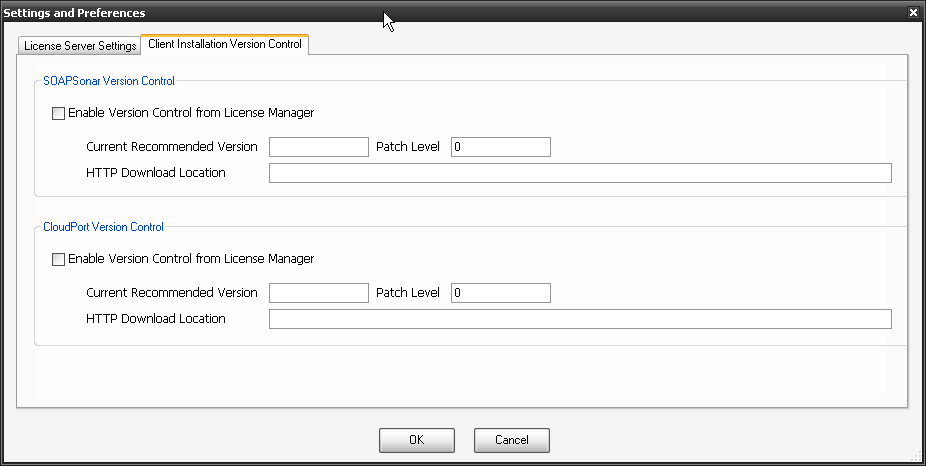
6. On the second tab, Client Installation Version Control, you can set the minimum or maximum version and the download location to ensure that your team uses the same release. This is helpful if you sharing projects.

Versioning

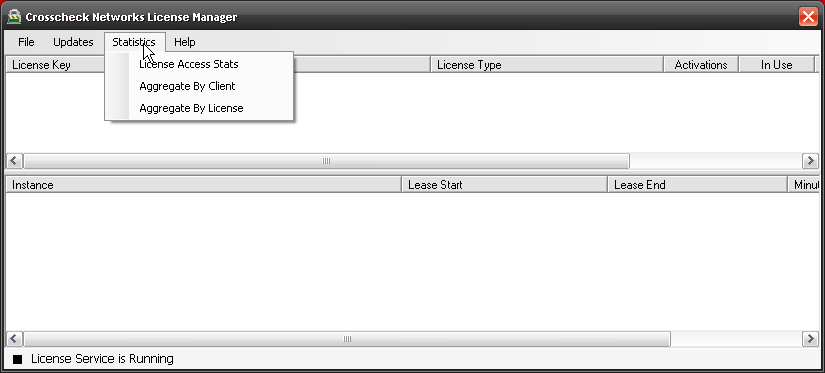
7. Statics offers a way for you to see which users use what licenses and how often. Enabling planning between seat and floating licenses.

7 Statistics

 8. On a workstation, download and install SOAPSonar. Its important to do this by right clicking on file and run as admin, for access to .Net libraries. Select Registration, Use License Server8 Check out

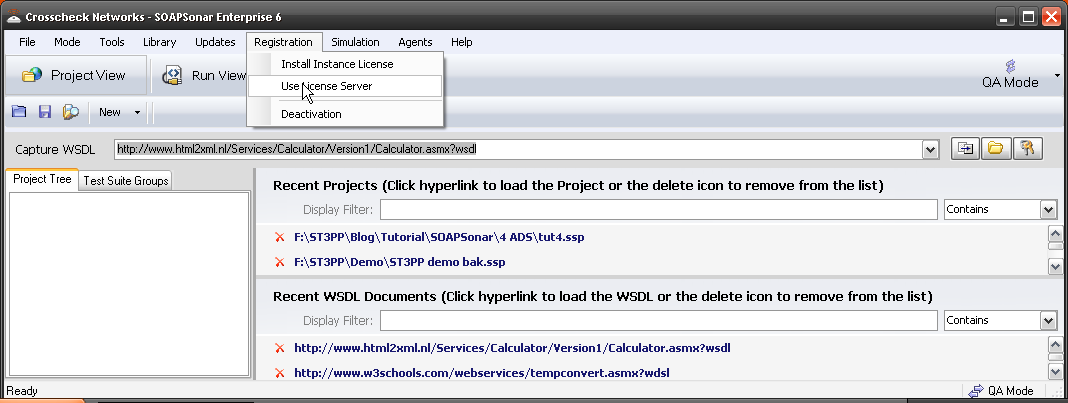
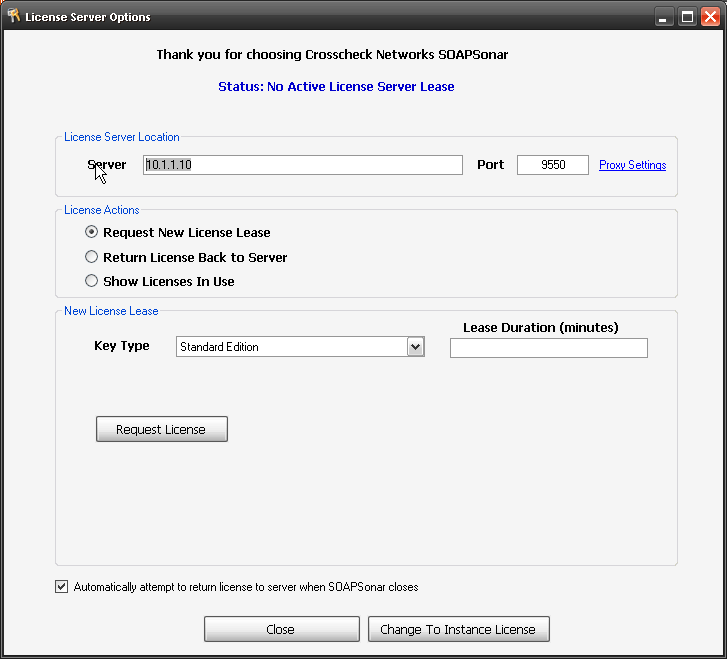
9. Enter the IP address and Port of your license server, Select Key Type and Request License.

9 connect

If you have any question, please just reach out to me.


ST3PP Presenting at TASSQ in March

Join us at TASSQ this March the 25th in Toronto at the The Albany Club – King & Church Streets 5:30 pm networking 6 pm dinner 7 pm presentation. March’s presentation will be done by ST3PP’s me, Ivan Flowerday. Visitors and new members are always welcome at TASSQ and attendees include anyone who has an interest in software quality, or software testing, whether they work for a large corporation, a small software house, or whether they are independent consultants.

ST3PP’s mission is to Align the domains of Tools, Process and People, to achieve excellence. At TASSQ, I will be sharing some thoughts and ideas collected by meeting with a number of QA and Development organizations. The session will also be interactive, with attendee participation.  Although it will cover all 3 domains, no specific organizations Tools, People or Processes will be used. The intent being to generate ideas or thought that members can further investigate, and perhaps apply in their teams. Similar to much of ST3PP ahead newsletter.

To give you some idea of what I will be discussing you can read a detailed look at service plan costing

We look forward to seeing you there and please stop by an introduce yourself if you have not already.


KPI – Identifying Areas in Process that Requiring Tuning

Both Six Sigma and CMMi focus on creating and managing a feedback loop. Assessing the current status in your organization and then identifying areas for improvement.  To do this, KPI or Measurement Objectives are needed to measure the effectiveness of your organizations Tools, People and Processes. Measuring details like Defect Density, Test Coverage, Total defects, reliability etc. Then collecting the relevant data and analysing these measurements to provide insight into the the results, set goals and track progress.

One of my favourite tools or methods to visual and analyse KPI is via Pareto Graph. Its simplicity makes the 80/20 rule stand out to any level of an organization. In the above example the first 7 groups of defects is clearly well over 80% of the all defects. The impact of addressing the others being minimal, while a small change in the first 3 could have major impact to your organizations quality.

Potential issues with Pareto Graph.

Although extremely helpful in identifying areas that need to be addressed, there are some potential pitfalls on relying on Pereto analysis too much. These include

  1. It is important to define and group the categories correctly. They need to both be precise, so that there can be little doubt as to which category the defect fits into and they need to be of a suitable granularity. Making larger groups, can make addressing the sub issues in the groups difficult, yet making too many sub-groupings can result in loosing the visual effect and intent of the pareto.
  2. Selecting appropriate time periods is important. Measuring only a single release cycle or team, can result in wild fluctuations in results. Consolidating multiple teams, releases etc can cloud visibility into a particular team or release issues.
  3. If changes are made to the Tools, People and Process, to address the issues identified in the  pareto chart, adding them to the same period will not offer any insight into the effectiveness of these changes. These changes need to be compared to a previous baseline. Baselines however can become rapidly dated.
  4. Pareto analysis is draws focus on areas of greatest need, but a laser focus only on those areas, can rapidly destabilize others. Some of these other fixes could be potentially low hanging fruit requiring little effort to resolve.
  5. Although Pareto analysis identifies common areas that may require focus or consideration, it does not supply solutions.

Poll

What I have learnt is that when someone sits down and actually gathers the information and generates a Pareto chart for analysis, they are almost always surprised by what is revealed. For benefit of all,  I wanted to take a short Poll.  First off, looking at teams that do use pareto analysis and teams that don’t.  What I would be interested in seeing, is if these teams see common or different set of issues. In other words, does doing a pareto analysis change peoples list of most common defects. The results will be collected privately and consolidated by me, and posted at a later date. Comments at the bottom of the page posted before hand for public, but comments in the poll kept private unless you stipulate in them you wish to be mentioned.

Please take a minute to weigh in and help others ST3PP ahead.

[contact-form subject=’pareto analysis’][contact-field label=’Screen Name’ type=’name’ required=’1’/][contact-field label=’Does Your Organization Use Pareto Analysis’ type=’radio’ required=’1′ options=’Yes – we review them frequently,No – I have never seen one for my organization’/][contact-field label=’1 – Most Common Defect Group’ type=’select’ required=’1′ options=’Business Changes – Missing or added business functionality,Design Defects – Missing or incorrect architecture requirements,Developer Defects – Missing or defected functionality in code,Environmental Defects – Versioning%26#x002c; enablers or other other site issues,QA Defects – Incorrectly identified as a defect,Other – Please describe in comments’/][contact-field label=’2 – Second Most Common Group’ type=’select’ options=’Business Changes – Missing or added business functionality,Design Defects – Missing or incorrect architecture requirements,Developer Defects – Missing or defected functionality in code,Environmental Defects – Versioning%26#x002c; enablers or other other site issues,QA Defects – Incorrectly identified as a defect,Other – Please describe in comments’/][contact-field label=’3 – Third Most Common Group’ type=’select’ options=’Business Changes – Missing or added business functionality,Design Defects – Missing or incorrect architecture requirements,Developer Defects – Missing or defected functionality in code,Environmental Defects – Versioning%26#x002c; enablers or other other site issues,QA Defects – Incorrectly identified as a defect,Other – Please describe in comments’/][contact-field label=’4 – Fourth Most Common Group’ type=’select’ options=’Business Changes – Missing or added business functionality,Design Defects – Missing or incorrect architecture requirements,Developer Defects – Missing or defected functionality in code,Environmental Defects – Versioning%26#x002c; enablers or other other site issues,QA Defects – Incorrectly identified as a defect,Other – Please describe in comments’/][contact-field label=’5 – Fifth Most Common Group’ type=’select’ options=’Business Changes – Missing or added business functionality,Design Defects – Missing or incorrect architecture requirements,Developer Defects – Missing or defected functionality in code,Environmental Defects – Versioning%26#x002c; enablers or other other site issues,QA Defects – Incorrectly identified as a defect,Other – Please describe in comments’/][contact-field label=’Private Comment To Me’ type=’textarea’/][/contact-form]