Search for:

3 Ways to Get Started with CloudPort – Using WSDL

As part 3 in this series. In the first we captured a service using CloudPort’s proxy feature, and in the second we created a service copying and pasting mostly. In this tutorial we use a SOAP service that has WSDL. SOAP services currently differ from REST based service in that they include WSDL that defines the structure and parameters if the message header and bodies. In this case, I will use the simple temperature convert SOAP service.

1. Start CloudPort and select Build Simulation. In the Capture WSDL bar enter the URL followed by ?wsdl or in our case paste

http://www.w3schools.com/webservices/tempconvert.asmx?WSDL

1. Capture WSDL
2. Change the Network Listener Policy – in my case I just changing the port to 8888 and will leave it on local machine, and commit.

2 listener

3. Now we can define any specific Request or Response values. You could build a VB script or create a random variable or any of a number of ways to match requests responses. In this case, our test coverage is 3 values.

  • 0 Fahrenheit response expected -17.7777777777778
  • 72 Fahrenheit response expected 22.2222222222222
  • 100 Fahrenheit Response expected 37.7777777777778

So lets start by cloning the FahrenheitToCelsius simulator 3 times and renaming it 0, 72, 100

3. Clone

4. Now we need to change the rules for inbound documents. The default rule recognizes any value. Right click on the actual value and select Add XML Element Value Criteria, Contains Value for each of the 3 cloned services.

4. Rule 1

5. Now selecting the rule allows for entering the value. Enter 0, 72, 100 in each of the clones services and Exact Match.

5. Rule

6. Now Select the Response tab, and enter the desired response value for each of the 3 clones simulators.

6 Response

7. If you want to test Celsius to Fahrenheit you can repeat this process.

8. Now launch your created simulation by selecting the green arrow icon Start Local Simulation. The Free Simulation player will launch and show you the URI and rules available. Select Copy Generated WSDL to Link icon. This is the listener we set up in step 2.

8 copy

9. In SOAPSonar now, paste that WSDL link into the Capture WSDL field and the 2 services are shown in the project tree.

10. Test the 3 services listed in point 3 now. Do you get the expected response?

9 soapsonar


3 Ways to Get Started with CloudPort – Create

In the first in this series, we used an iTunes JSON service and made a request via SOAPSonar while we capture the request and response using CloudPort’s proxy feature. This is great when your service is developed and available, but what if the service you need does not yet exist or needs to be altered?

Since I am not developing a service, I am going to use SOAPSonar to make a request of the real service and get a response. Then I will simply copy this response and paste it into CloudPort (with a small edit) and set up the right listener policies.

1. We going to do a second iTunes JSON GET to list of  albums for a given artist. Starting with SOAPSonar (you can use the same or start a new project) lets Create Two New JSON Tests. Lets rename the first alt-J albums and second Black Keys albums. The queries are

If you wondering were this came from, I read the service description document and too the ID value from the artistic response from the previously used search service. Commit and Send both. Now we have the requests and responses.

1 soapsonar query

2. Open up CloudPort, you can create a new, or use the previous. Right-click on Tests and create 2 New JSON Simulators. Rename them alt-J Albums and Black Keys Albums.

1 New

3. Now we need to establish the end points and queries or listeners. Select Add manual Rule and set the listener Target to URL and the paste the /lookup?id=558262494&entity=album in as the URL. Ensure its set to Exists. Once you created the new rule, delete the old catch all rule. If you wondering were this came from, its everything we sent as a request after the http://itunes.apple.com/

3 Simulator

4. Now do the same for Black Keys setting the target URL this time to match /lookup?id= 5893059&entity=album and Exists. Notice there are a number of ways to identify a incoming request to and hence trigger a response.

4 simulater BK

5. If you are using a new project, you need to also set the Network Listeners. If you using the same project as in the capture tutorial this should exist. Make sure yours looks as below with Name, IP, Port 8888 and URI.

5. Network Listner

6. Now we need to set up the responses. There are two parts to each response the header and the body. Go back to SOAPSonar real query and copy and past the entire response header and body into CloudPort Response tab. Then commit.

6 copy

7. Do the same for the second Black Keys service for both header and response.

7 response

8. Now we could edit these, adding albums, changing structure or renaming things, but the bands may not be happy. So all I will add is a small change above wrapperType

“simulated”: “simulated using CloudPort”, (make sure you have the , for correct JSON notation)

to both. 

11. New service

9. Notice if you look at the Response Runtime Variables tab, if you response is correctly JSON formatted the graphical view will populate. If its is not, the response will still be sent, but you will not be able to use variables and the client may not understand your response.

9 graphical view

10. Lets test our newly created services. Launch the Simulation Player, by selecting the green arrow icon. Notice your listener URI and we now have 4 simulated services.

10 simulation player

11. Now clone the two real SOAPSonar services and change the requests to

Do you see the changes we made?

In this example we added one line or possible variable, but we could just have well created an entire service from scratch. Here is the zipped create simulation.

3. REDUCING SCOPE – TEST ITERATION STRATEGIES

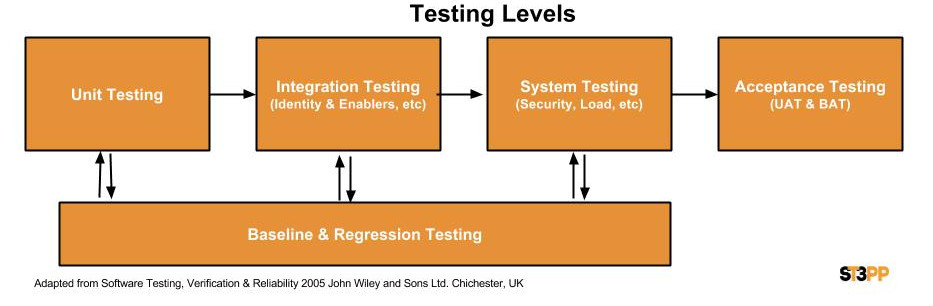
Following on from SDLC strategies, the second group or area to focus on when attempting to reduce the total amount of testing is ways to reduce the number or Test Iterations or levels.

Testing Levels

Every organization has their own st3pps in their SDLC and organization structure. This often depends on the defined roles and functions in the organization and their development approach. A large waterfall based organization may have dedicated security, identity and load testing teams, while a smaller agile organization may have these functions fall under a single team or person. In every organization, there is a struggle between finding the most efficient process vs budget, personal agendas and overcoming inertia. “Its always being that way”, and “its done by a different team” does not imply optimized.

Unit Testing

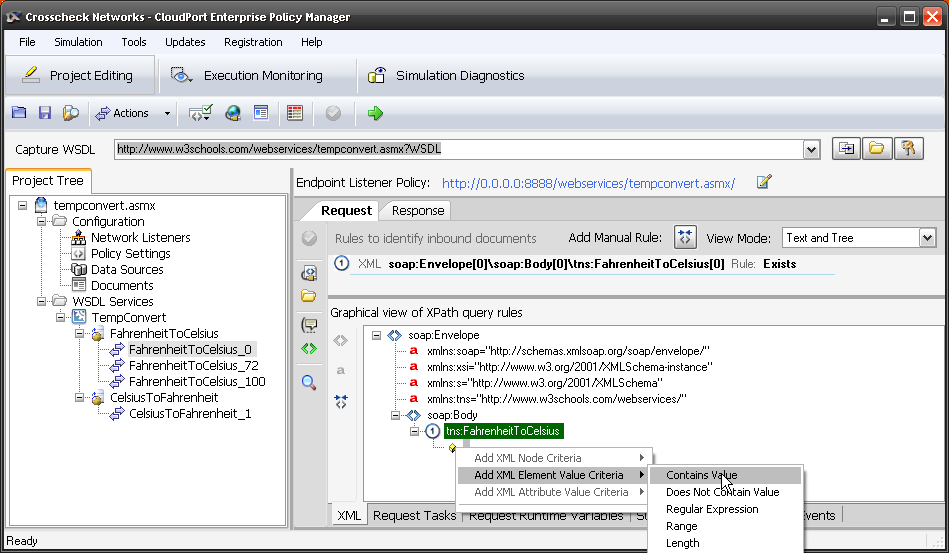
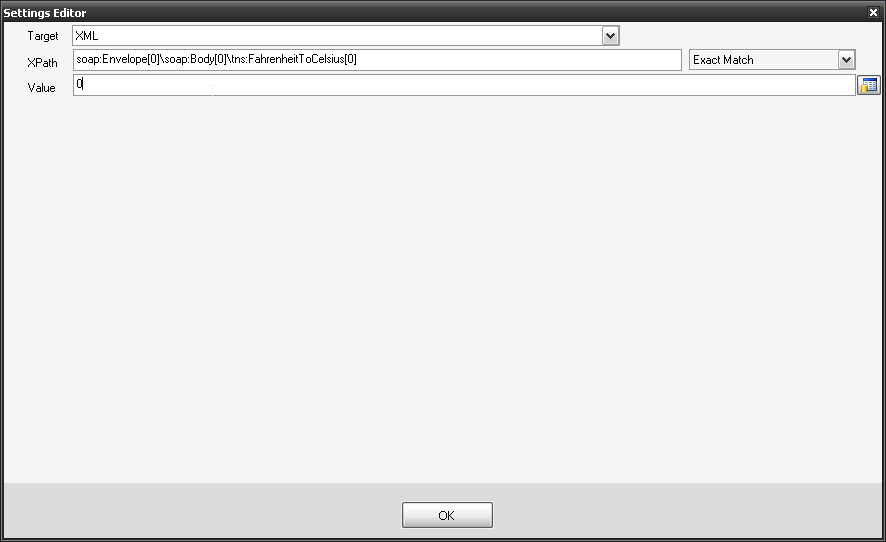
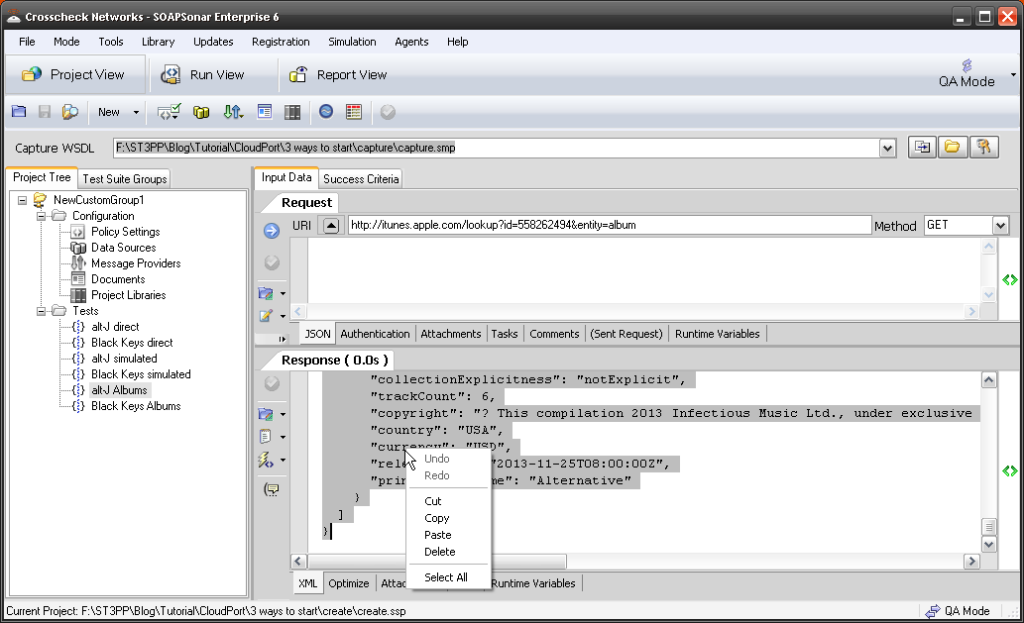
With JSON services not having WSDL or Schema, many organizations have had to find new ways for Development and Testing to work together to ensure the correct coverage. Developers and testers may work off the same service description document, but how accurate is the document and how well does it match the developed services? What if a developer added or missed some functionality when coding? How does Testing even know what services are there for testing? Group development like Agile or Extreme programming may help, yet requires testers to have a fair understanding of JSON.

A second challenge is how do you gate or ensure that developers have done at least some level of due diligence before passing the code drop over to Testing to begin testing. If the defect density is to high, and code needs to be heavily reworked, the entire test cycle is wasted. If previously found issues are not suitably addressed, the same retesting is again a waste. Release management can take significant amount of time and resources.  To prevent this, various organizations have tried different approaches. From formal sign-off’s, to change documentation or release management and change management tools. Another approach, is to have one team develop the basic unit test, and this test be used as the gating process. Testing then takes these unit testes and expands them out to include far more intensive coverage. In SOAP its most often the testers that develop the unit test, but with JSON, it is now sometimes the developers that develop the unit test together with the service. Sharing tools and test cases only makes sense, as the developers require some way to test the code they developing in any case. Handing it to testing to expand is good practice, to ensure that “fresh eyes” are used. But what if a developer adds code not in documentation and does not hand a test case over either? Is this risk acceptable?

Whatever the approach, the objective remains the same, from release 0.1 to GA, how can one reduce the number of test cases. The concept also remains the same – Shift as much Testing as possible left, or earlier in the SDLC right to testing while developing and making sure that “code drops” have a certain amount of maturity.

Integration Testing

Integration testing of old was usually a different team to that of Unit testing. As per the post on Continuous Testing in Agile, if using and automation tool, the test cases should be the same. Integration testing, should just include expanding the test cases developed in Unit Testing to include things like encryption, cookies, identity, performance of each service (and enablers) etc. These individual test cases then linked for automation in what we call chaining. Integration testing often then be done concurrently with unit testing, much earlier in the SDLC.

Using the right automation integrated tool, that supports encryption, identity, performance and as many of your integration tests in one, enables the elimination of distinct test cycles for each of the Integration tests. SOAPSonar’s ability to do functional, security, performance and load testing using the same test case, is the number one reason customers say they selected it. That said, Performance of a individual service is something I recommend be part of a unit test and a functional requirement.

Consolidating integration tests into as few as possible and shifting as much as possible into functional unit test cycle can greatly reduce the number of iterations. The impact of removing a single test iteration can clearly be seen in service plan costing model. This is not about increasing risk by skipping systems tests..

Systems Testing

Systems testing requires a certain amount of code to be developed and tested, and the environment to be built.  Moving it too early in the SDLC can actually add to the testing needs. On the other hand, if the integration and unit tests are all automated, and completed successfully, systems testing becomes more about the environment and less about code. Finding code quality issues at this point can be very expensive and troublesome to fix in time.

Again if all the unit tests, and integration tests are automated in the same test case, and if the tool offers the ability to do systems test eg geographically dispersed load testing, the effort required during this iteration can be greatly reduced. A note on performance vs load testing. Too many times I hear that performance testing is left till Systems Testing and suddenly its discovered days before release that there are performance issues. How a service performs should be tested far earlier. At this stage, Load testing should be establishing that the environment (servers, network and other infrastructure) is suitable and not a individual services or enablers performance.

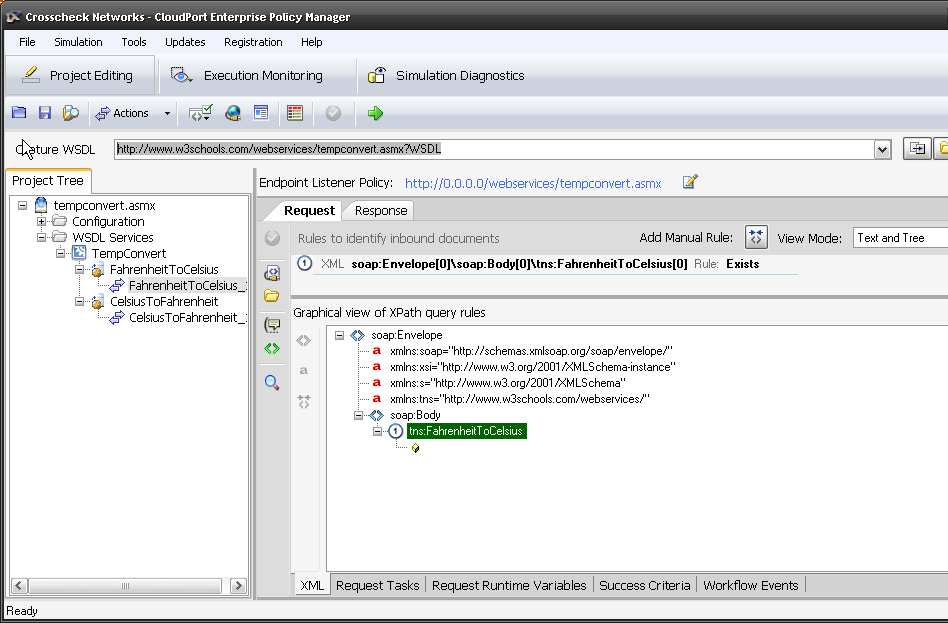
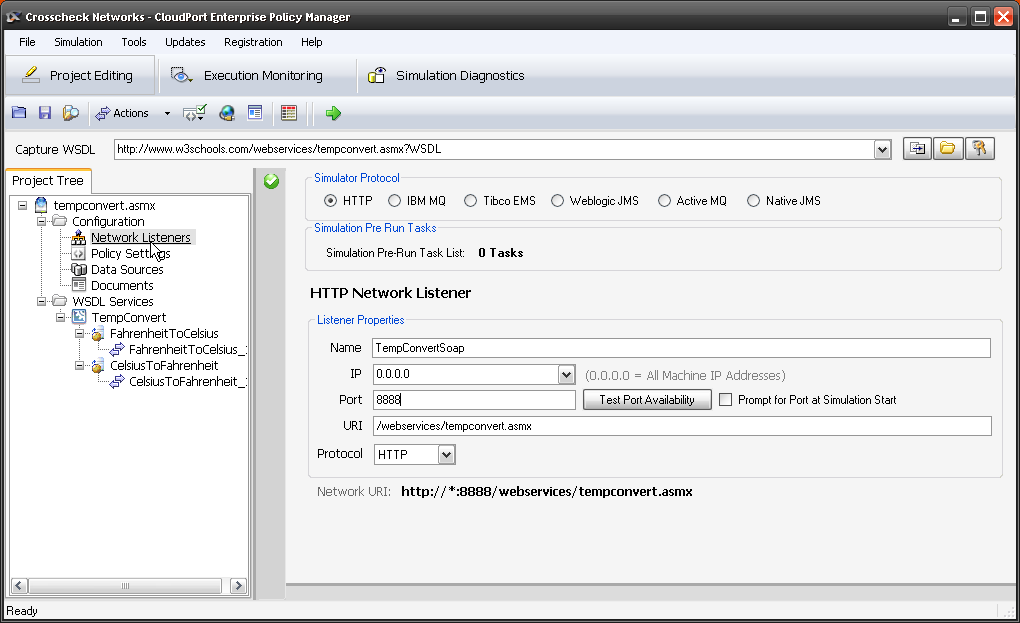
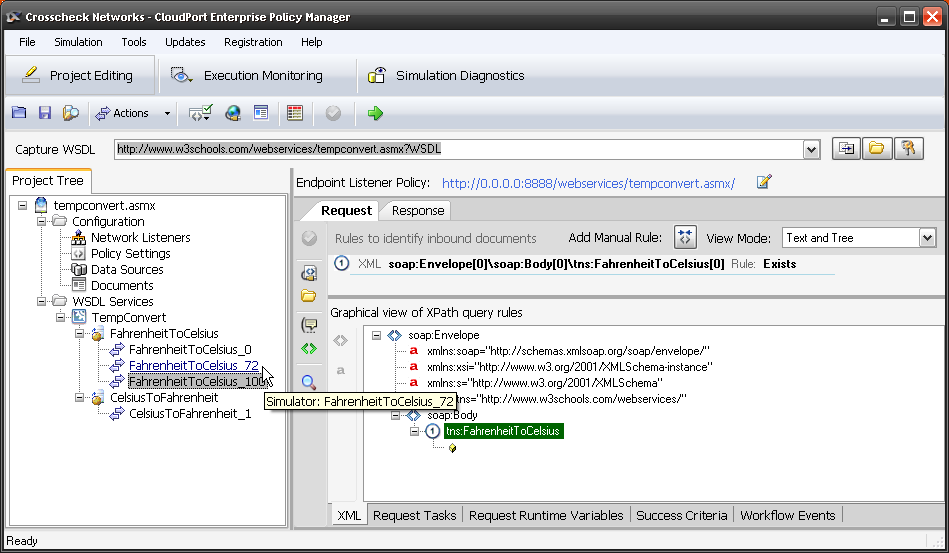
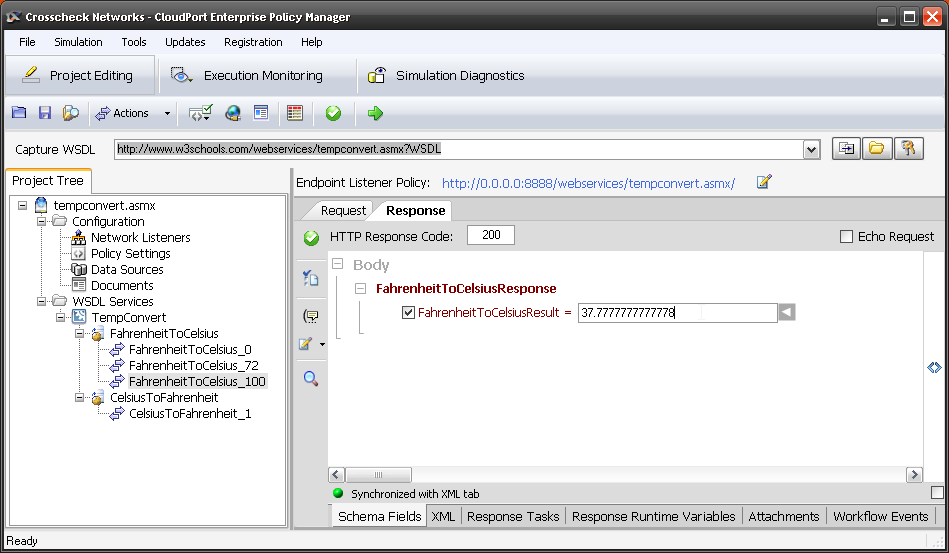
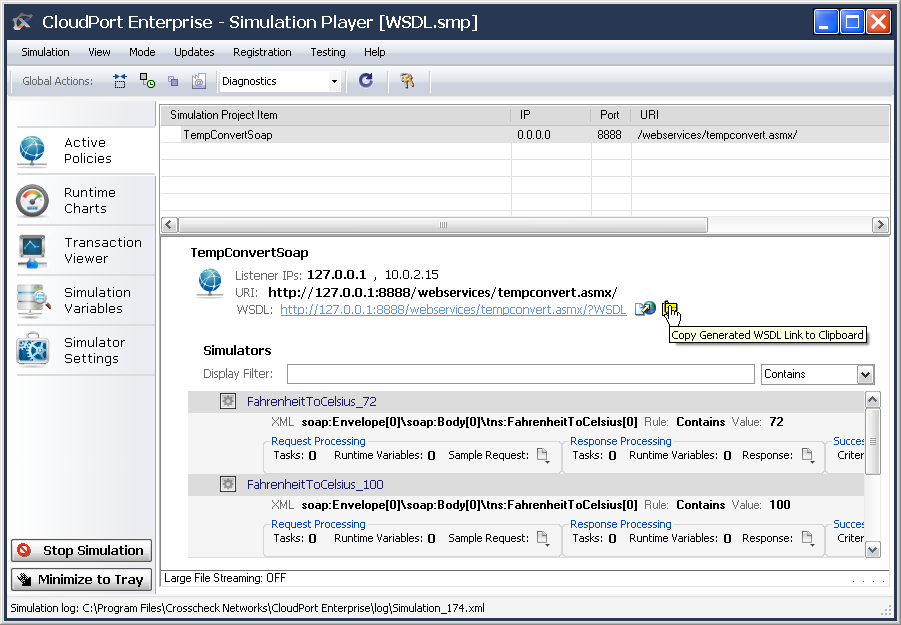
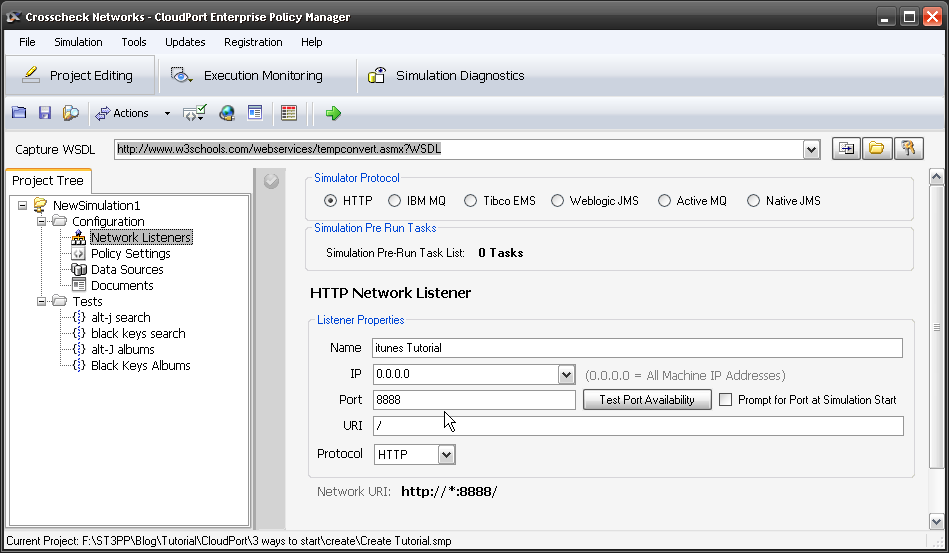
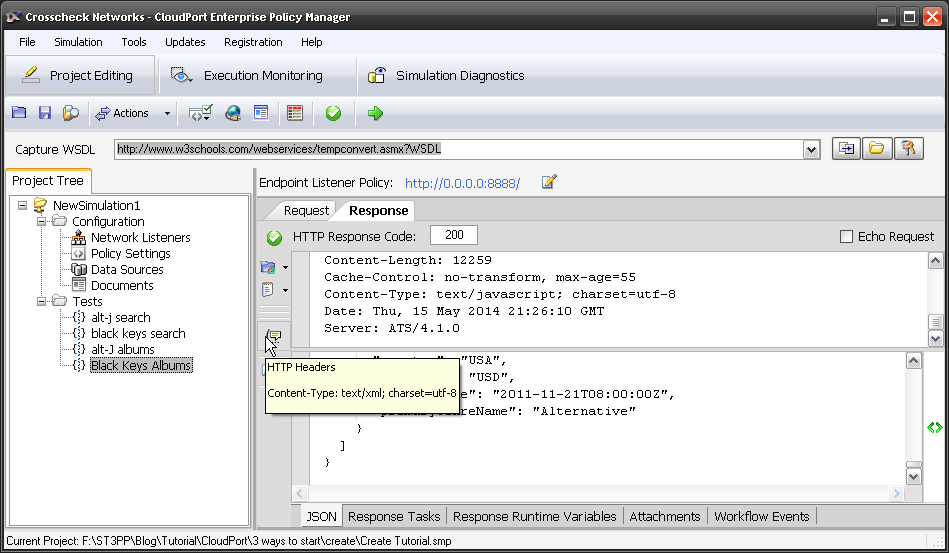
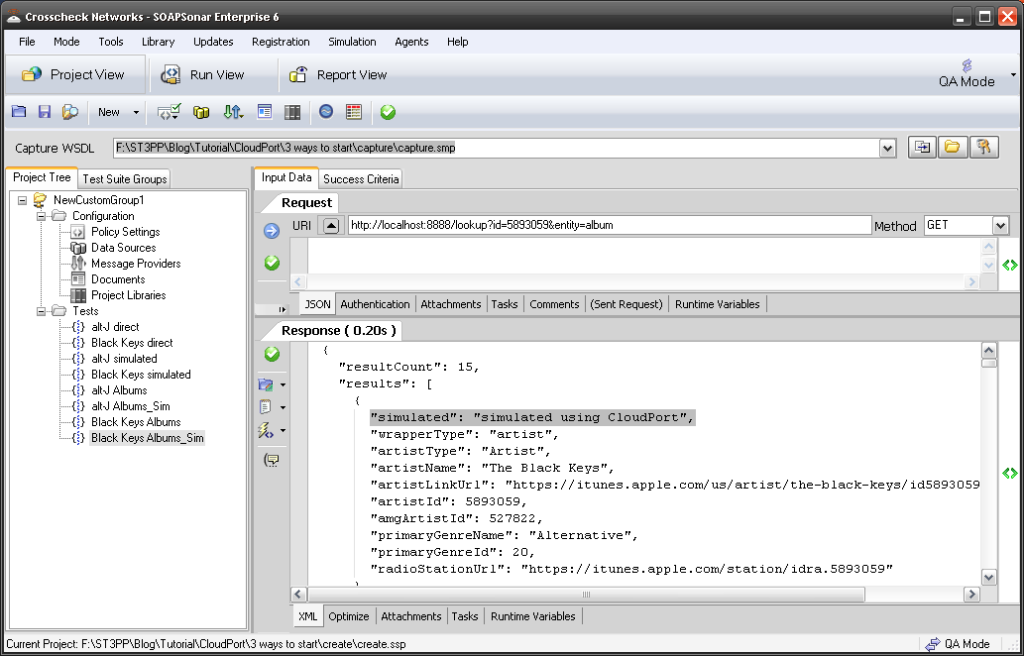
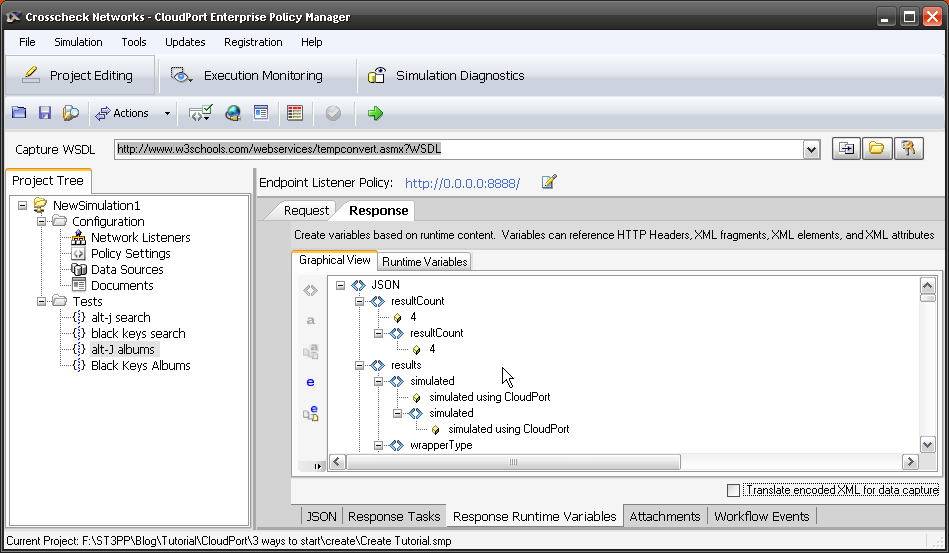
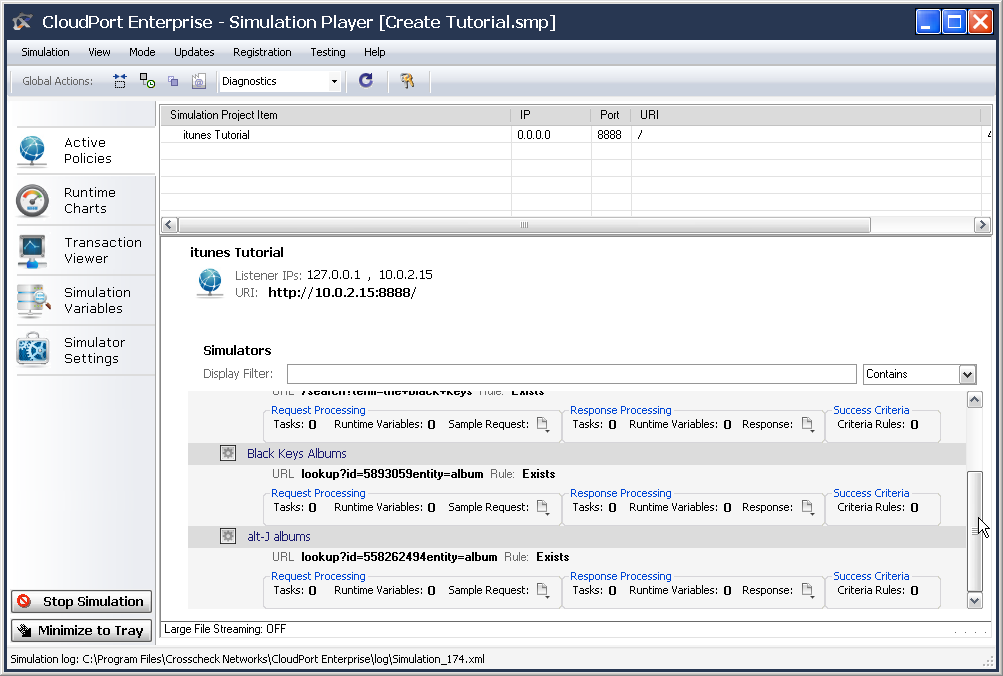
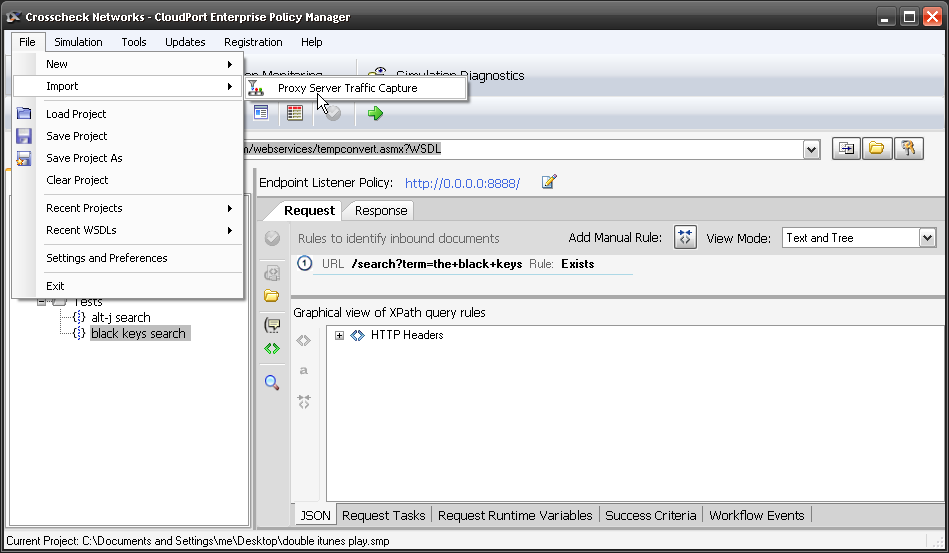
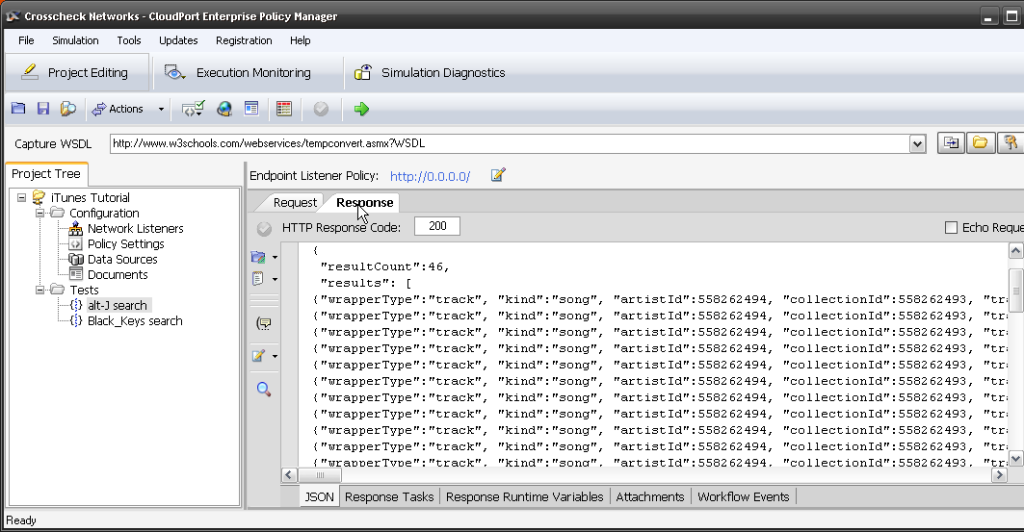
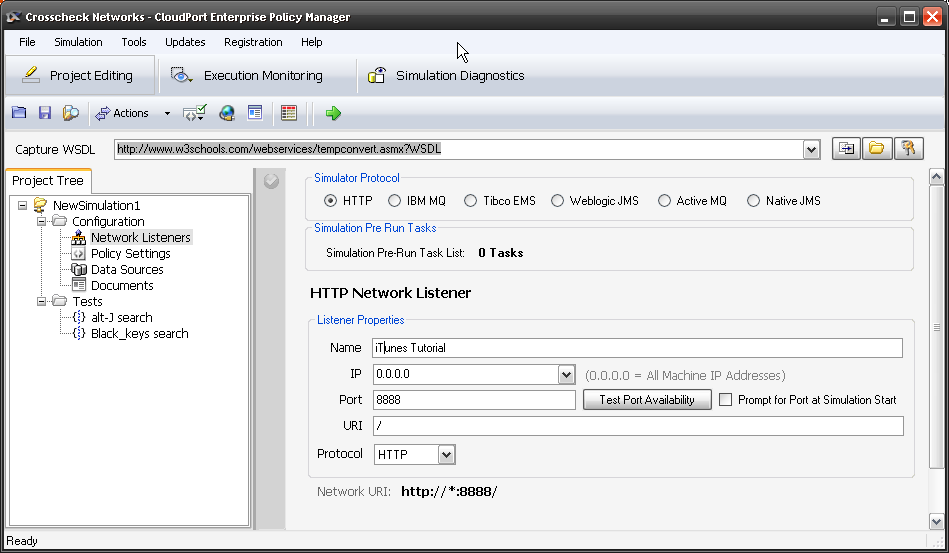
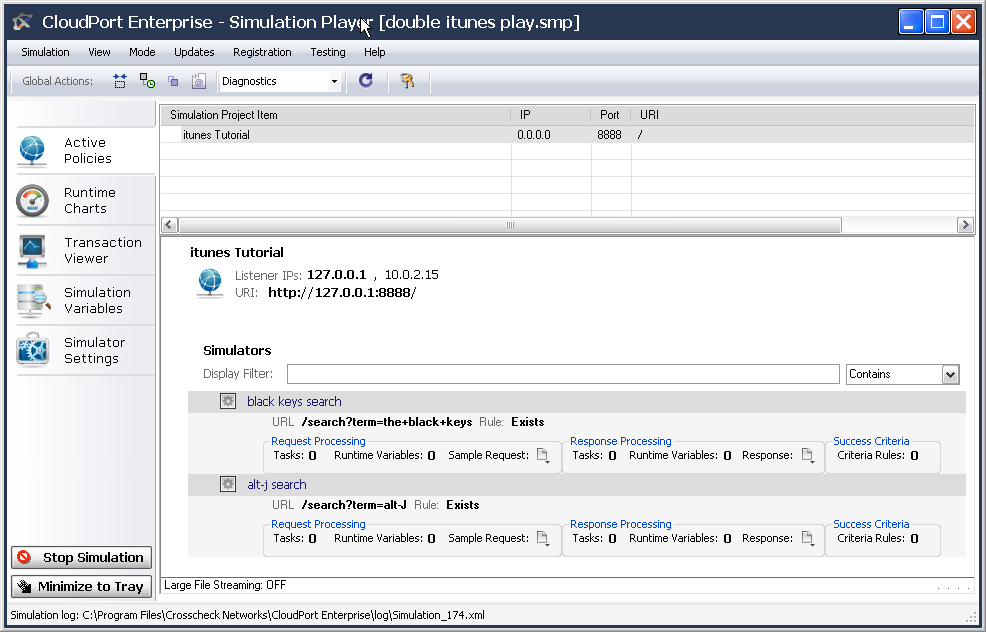
Using Virtualization or Simulated Services to stand in for services either unavailable or that cannot be load tested can be very useful in enabling earlier Systems testing. Simulated services are key trouble shooting tool to eliminate environmental factors like network, cloud, data integrity and servers.

ACCEPTANCE Testing

Acceptance testing is were you suddenly discover if all the work was correctly focussed. Have your Developers and Testers spent all this time developing and testing the right requirements?  NIST lists business requirements as the number 1 issue in software development. Often the users and sponsors are not technically minded and extracting the requirements can be very difficult. Bringing Acceptance Testing in earlier to review what is being done can greatly decrease time and effort spent in incorrect requirements delivery.

In web services, acceptance testing is usually heavily weighted on the client side usability and visuals. The need to see an example and not just a jpeg. This is another benefit of Simulated services. By creating a basic simulated service earlier in the SDLC, the GUI team can begin work. This GUI can then be used together with the simulated services for earlier acceptance testing and to compare to the end services built.

Regression

Regression testing between releases is an important way to minimize the testing scope. If a regression test of a service shows no code change between release 0.4 and 0.5 then those services were not changed since the last test cycle and need not be tested again. lets say a regression test says 30% of the code was had no changes, using the service plan costing model, how much testing could that save? That said, if they automated, it may be of little benefit not “pushing that button” and retesting them.

Where regression testing really shines is post launch. The maintenance phase of software often costing far more than the development phase. Yet if your automation test cases developed during the development cycle can also be used for regression testing during the maintenance cycle, the effort is greatly reduced. This “continual testing” post production and even API monitoring is rapidly growing area of focus for many organizations as more complexed meshed applications are being developed.

A note here, so often I hear that security or some other team wont allow for automation. The impact however of a single systems test iteration not being supported can cause any automation to be useless on production environment and prevent any regression testing using the previously built test cases.

Conclusion

There is a lot about automation in this post. Every day I hear of benefits and issues with automation. Many organizations try apply automation to their old process and find little benefit and become discouraged. Alternately, a tester involved in load, security or some other single test iteration, seek a tool to do just that iteration – sometimes just for control of their environment, breaking the larger benfit by doing so. The key to successful automation is and end to end approach from the start of the SDLC through. You may choose not to automate the whole process, or use other tools, but the design and application of automation needs to be done with the entire cycle in mind.

The next post will be on ways to reduce the number of unit tests.


9. SOAPSonar – Performance

One of the benefits of SOAPSonar is that performance and load testing use the same automation tests developed for functional testing. You just need to switch the mode from QA to Performance on the top right. All data sources, Projects, Test Cases and Test Suites remain unchanged. This allows performance and load tests to be built into functional requirements and regression testing, without creating a new series of test cases in a separate tool.

In order to do performance and load testing, and prevent any accidental denial of service attack, we need to use a CloudPort runtime. Its free, it local and it integrates well with SOAPSonar. Its also a useful tool to have and one we will use for a number of future tutorials. So lets go ahead and download and install it.

1. Download and install the CloudPort Runtime Player. You have to accept export restrictions, but are not asked for no personal information.

2. Secondly, download the runtime, ST3PP performance and unzip it to a location you can find again. You should have 3 files. Tutorial v1 and v2 and a short csv. We use V2 in future tutorials.

3. Launch the CloudPort Runtime Player and select run simulation, then find Tutorial v1 you downloaded and unzipped in step 2. Start Simulation Player. Accept port 8888. (good idea to Test availability)

3 run player

4. You now should have a JSON Simulation running on your machine to test against. If you look under Performance Test Tutorial, next to the icon of the networked globe,  you will see the URI should be http://127.0.0.1:8888/st3pp/ and the list of simulated services running, starting with soapsonar. Lets not change anything else here yet, but copy the URI http://127.0.0.1:8888/st3pp/.

4. Simulation

5. Leave the runtime running and launch SOAPSonar and lets create a basic JSON test case. You can do this by selecting Testing and then Launch SOAPSonar Testing Client from within CloudPort runtime or you can just run SOAPSonar as you usually do. Select File, New, Test Group then Right-click on Tests in the Project Tree and Select New JSON Test Give it a name like Performance

5. New Test

6. There is a small CSV file in the zip file you downloaded in step 2 called performance.csv. Lets add that as an [ADS]. In the project Tree under configuration, select Data Sources. Add Automation Data Source, then Select File Data Source. Give it an alias, find the performance.csv you extracted and ensure the Data Variables is on Request column, then select OK.

6 ADS

7. Back at our test case “performance“, paste the URI copied from CloudPort or http://127.0.0.1:8888/st3pp/ into the URI. Then add the query. In this case it will be ? followed by right-click and the [ADS] and our Request column. Set the method to GET (although it matters not in this runtime). Commit and Send Current Request to Server. Did you get a response that’s not a error? So far this has all being covered in earlier tutorials. your response should start with “Delivering”: “SOAPSonar”

7. Project

8. Select Run View and drag our test case over to the DefaultGroup. Check to make sure you right hand top corner is QA mode and Success Criteria is Test Case Success and not Regression. Then Commit and Run.  All 6 Test cases from the .csv should run and pass. Did they? Select Report View, and notice that 2nd Test case CloudPort took over 500ms and the 4th test case Tools, took over 1000ms. This is because the runtime has some latency added for these two cases. These individual services, not under load perform slower.  So far you have being testing functional testing. If we wanted to we could add a success criteria now and fail any service over a certain response time, now would be a good time.

8 Slow

9. lets go back to Run View and Change SOAPSonar from QA Mode to Performance Mode in the right top corner.  Notice that Suite Settings Changed? Now if we select Run Performance Testing in Synchronous Mode, each test group is run sequentially and each test case performance statistics are isolated and run individually. Asynchronous will run all your test groups at the same time to replicate different traffic patterns. We only have one test in one group. So lets leave it on Synchronous. Lets also leave the rest for now. Careful with logging as it can effect your machines load and hence performance.

9 Synchronous

10. Select the next Tab, Group Performance Settings. Here we establish the number of Virtual Clients and the length and extent of the load. Select just 3 virtual clients and set it to Duration and 3 seconds. Leave Throttle unchecked as we see how many TPS we can hit with 3 Virtual Clients. We have made no changes to the [ADS], functional test, regression or success criteria. Commit and Send.

2014-010 Virtual

11. This time your Realtime monitor is different. In report view, you see a consolidated report, when you select that, you see a break down per virtual client. East virtual client can export a file for further processing or you can generate a report. How  many TPS did you hit? We highly recommend using the 90% Res Time column as a reference, ignoring the 10% of responses that are extra long or short.

11 Report

Conclusion.

Doing load and performance testing as early in the development cycle can be critical in finding the time to address any concerns. Using the same test case and simply switching to performance mode vs developing a new set of test cases in a different tool, enables far greater coverage and reduced time.

In our next tutorial we will use both virtual and physically distributed load agents in a performance and load test.

Take a minute to give me some private feedback in the form below. This will be mailed to me and not published.

[contact-form subject=’Performance Testing’][contact-field label=’Handel’ type=’name’ required=’1’/][contact-field label=’My opinion on Perfromance and Load testing is :’ type=’radio’ options=’Why would anyone do Performance or Load tesing?,We do Performance but not Load testing,We use different tools for Performance and Load testing,We use an integrated Tool for Performance and Load Testing’/][contact-field label=’We do performance testing as part of Coninous and Regression Testing’ type=’checkbox’/][contact-field label=’Comment’ type=’textarea’ required=’1’/][/contact-form]

Otherwise please post any public comments below.

3 Ways to Get Started with CloudPort – Capture

This is part of a 3 part series on creating simulated services. CloudPort comes with a proxy capture tool to Capture and then replay a simulated version of the service that currently exists. A simulated, response will remain static, and not effect data integrity of the enablers, but can be load or otherwise used for testing. Workflow and tasks allow for some additional intelligence, but we keep this about getting started.

Lets use iTunes RESTful JSON service. Since I have this song in my head, and the documentation for how to use this service is available. As you will see, the response can be quiet lengthy.

1. Lets test the actual service first. Open SOAPSonar, and File, New Test Group, right-click, New JSON Test Case, and rename it Direct. Paste

http://itunes.apple.com/search?term=alt-J

into the URI and method as GET. Commit and send.

1 direct

2. Now in CloudPort, select Tools from the menus bar, then Proxy Server Traffic Capture Tool.  Make the local port 8888 (easy for me to remember) and then paste itunes.apple.com into the remote server and Start Proxy Recording. You now capturing all requests made to your local machine on port 8888, which is then forwarded to itunes.apple.com.

2 Proxy

3. In SOAPSonar now, lets send the request to be captured. Clone Direct test case and rename it Proxy. Now change the URI from itunes.apple.com to 127.0.0.1:8888 which is your local machine running CloudPort on port 8888.  The entire query will look like

http://127.0.0.1:8888/search?term=alt-J.

Commit and send.

3 Capture

4. You can send as many queries to that domain to capture as you need to match with your test cases you will run. Lets add a second. Clone proxy and change the URI to  

http://127.0.0.1:8888/search?term=the+black+keys.

Commit and send.

7 Rename

5. You can see the request (header) and the response in the capture tool. Stop the Proxy and Export Data to File. Give it a name you remember and save it. The close the Proxy tool.

5 export

6. Now we need to import the captured file. File, Import, Proxy Server Traffic Capture. We know its JSON, so lets select that vs. leave as auto detect. Either should work, although some services dont always adhere to all standards. Find your captured file. When you import, CloudPort asks if you would like to keep response timing. If you say yes, the new simulated services will perform at the same response times. Select No.

6 import

7. Now you should have a NewSimulation1 with 2 Tests. If you select the first, you see in the Request tab,  URL /search?term=alt-J Rule: Exists as 1st rule. The second test URL /search?term=the+black+keys Rule: Exists. Rename your Tests to alt-J search and Black_keys search.

7 Rename

8. If you select the Response tab, you can see the JSON response captured. If you wanted to make any changes you could could just edit it here.  At the bottom is a tab for the JSON, but you can also see the Response Runtime Variables in much the same way you see them in SOAPSonar.

8 response

9. lastly, we can set the network listener location and port. Lets name this Listener iTunes Tutorial, leave the IP as 0.0.0.0 (all machines) and change the port to 8888. Lets leave the URI / and commit. Now the simulated service will run on localhost or http://127.0.0.1:8888/

9 listener

10. Now lets run the simulation in the realtime player. Select Start Local Simulation by clicking on the green arrow icon. The Free Simulation Player launches and you can see the iTunes Tutorial Simulated service. Below are the 2 services we captured. Copy the URI.

10. player

11. Now lets “test” these new simulated services. Clone or add 2 new services and use http://127.0.0.1:8888 and then the query for

  • http://127.0.0.1:8888/search?term=alt-J and GET
  • http://127.0.0.1:8888/search?term=the+black+keys and GET

Commit and send each one.

11 Simulated

Did you get a response? Can you tell it is different? Perhaps I need to do another tutorial showing a regression test of a real service vs a virtialized?

Comments/ questions?

PERFORMANCE TUNING MOBILE API – CLIENT

In my first post in this series, I highlighted the need to isolate and break down the user experience into logical and measurable portions to used as a baseline.

The client often gets the most focus the device in the users hand at the end of the chain of factors influencing performance. As it’s at the end of the chain, it is the sum of all the others and unarguably the user’s final experience. This being said, the client impact on performance is only the time added from the moment the device receives a complete message, to display. Or the point of submit till the time it leaves the device.  It’s may not be hard to identify when a mobile application is giving a poor user experience, but QA needs to also identify why. Read More